


Introduction
Contents
Gaming Consoles Statistics: By the end of 2026, the global market share of the gaming console industry is projected to exceed USD 75.54 billion, according to reports. The industry’s market share is experiencing significant growth worldwide, driven by factors such as additional perks, features connecting with the consoles, technological advancement, and rapid urbanization. These gaming console statistics offer insights into the rapid expansion of the market across the world in recent times.
Editor’s Choice
- The total money made from gaming consoles globally is expected to reach USD 24.1 billion by the end of 2024.
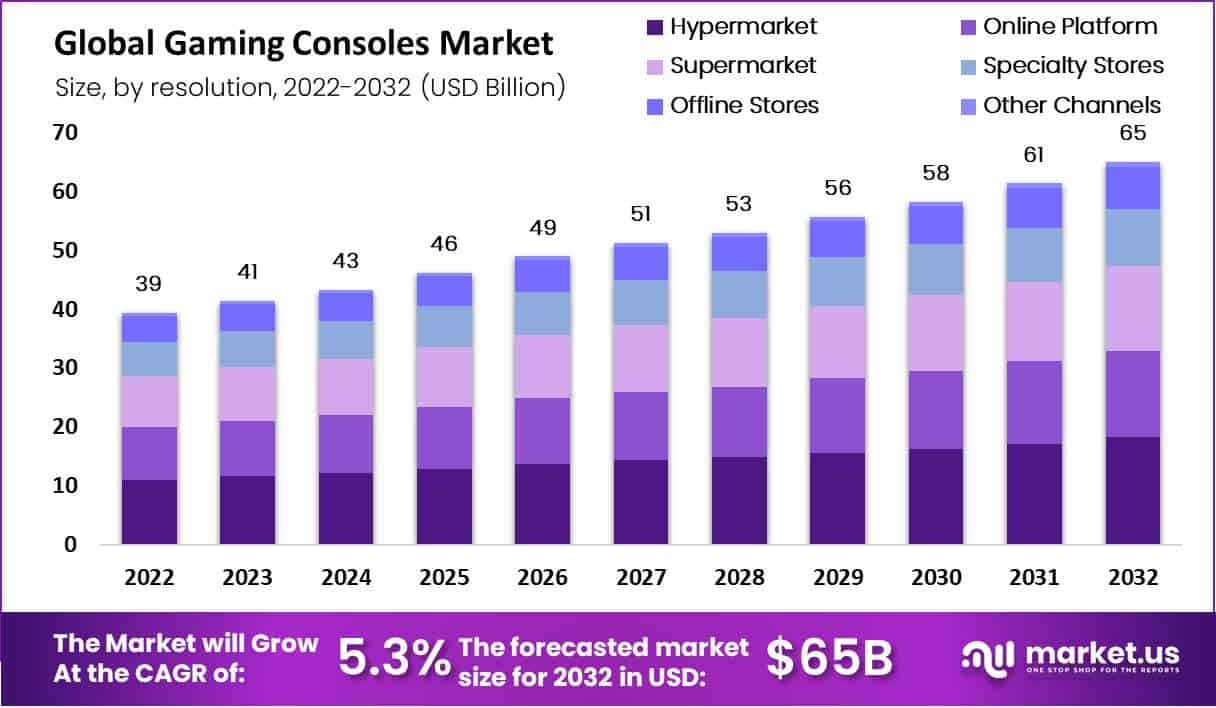
- The Global Gaming Console Market size is expected to be worth around USD 65.00 Billion by 2032
- In the United States, the money made from gaming consoles is likely to be USD 7,484 million by the end of 2024.
- On average, the revenue generated from each person for gaming consoles is estimated to be USD 3.11 in 2024.
- The total number of gaming consoles expected to be sold by the end of 2028 is 63.49 million units.
- In 2025, the number of consoles sold is expected to increase by 1.9%.
- In 2023, the biggest part of the market was for console hardware (like PlayStation, Xbox), making USD 19 billion.
- The annual growth of the console hardware market is expected to be 1.4% by the end of 2023.
- The PlayStation 5 was the most popular game console worldwide in 2023, with 45.4 million units sold.
- As of February 2023, Tetris is the top-selling console game, with more than 520 million units sold globally.
You May Also Like To Read
- Popular Google Doodle Games
- Xbox Statistics
- Hot Wheels Statistics
- Nintendo Statistics
- LEGO Statistics
- Golden State Warriors Statistics
- Gaming Consoles Statistics
- Gaming Monitor Statistics
Facts About Gaming Consoles
- By the end of 2023, there will be over 3 billion active video gamers worldwide, according to Techpenny.
- In 2023, revenue from gaming consoles is expected to surpass that of PC gaming.
- In the United States, 40% of adults own a gaming console like a PlayStation or Xbox.
- Global game console shipments grew by 32% in the first quarter of 2023, reaching 10.3 million units.
- The portable gaming console market is projected to reach USD 17 billion by 2027, with a CAGR of 6%, according to Market Research Future.
- The global 3D gaming console market is expected to reach USD 23.5 billion by 2026, with strong growth from 2021 to 2026.
- Major players in the gaming console market include Advanced Micro Devices Inc., Microsoft Corporation, Nintendo Co. Ltd., NVIDIA Corporation, and Sony Group Corporation, as reported by IMARC.
- Game consoles revolutionized home entertainment in the 1970s, transforming televisions into gaming devices.
- Modern consoles from companies like Microsoft, Nintendo, and Sony offer powerful processors, 4K and 8K resolution, and access to vast online gaming services.
- Global revenue from video game consoles in 2023 is expected to exceed USD 21 billion, up from USD 20.4 billion in 2022.
- The U.S. market is forecasted to reach USD 7.9 billion in 2024, with Europe close behind at USD 7.8 billion.
- Nintendo dominates the best-selling consoles of all time with the DS, Switch, and Game Boy, while the PlayStation 2 holds the top spot with nearly 160 million units sold.
General Gaming Consoles Statistics
- As of graph analysis, the gaming console market size in 2023 resulted in $53.36 billion and $75.54 billion by the end of 2028 with a CAGR of 7.20% from 2023 to 2028.
- According to top gaming statistics by developers, 31% of developers are working for PlayStation5 in the context of next-generation consoles.
- According to the reports of Data Bridge Market Research, the global market size of Gaming consoles is supposed to reach $115.42 billion by the end of 2029 and is expected to reach a CAGR of 9.5% from 2022 to 2029.
- According to the reports of Mordor Intelligence, by the end of 2023, the expected market size of the gaming console industry has reached $53.36 billion.
- Whereas, the revenue earned by this industry is expected to grow at a CAGR of 0.4% from 2020 to 2026.
- By the end of 2023, the global gaming console market is expected to grow at a CAGR of 4.3% from last year.
- In 2022, globally the bestselling video game console is Nintendo Switch with above 19 million units.
- According to reports, around the world average time spent on gaming consoles is almost 7.11 hours per week.
- In 2023, approximately 3.26 billion people around the world have played video games via consoles, PCs, tablets, and smartphones.

(Source: mordorintelligence.com)
Connected Game Console Statistics
- According to Future Market Insights, revenue earned by the connected game console market in 2023 resulted in $19.5 billion and is expected to reach $75.2 billion by the end of 2033 with a CAGR of 14.4% from 2023 to 2033.
- As of 2023, the largest connected game console market share was generated by the North American region and is expected to reach $18.5 billion by 2033.
- Whereas in the United States, the connected game console market is going to grow at a CAGR of 11.3% resulting in $5 billion in revenue in 2023.
- Whereas, the market in South Asia and the Pacific region is expected to grow at a CAGR of 18.6% from 2023 to 2026.
- In the East Pacific region, China has adopted the highest connected game console in 2023 and is predicted to grow at a CAGR of 16% from 2023 to 2033 resulting in $4.7 billion by 2022.
- Whereas, in Japan, the market share of the connected game console market is expected to grow at a CAGR of 18.1% from 2023 to 2033 and result in $3.4 billion by 2024.
- Based on application, the non-gaming segment is expected to grow at a CAGR of 16.1% from 2023 to 2033.
- According to the reports of FMI, the console service segment is expected to reach a CAGR of 13.3% from 2023 to 2033.
- Based on application, the highest growth is going to be captured by the gaming segment with a CAGR of 16.1% from 2023 to 2033.
By Type
 (Reference: statista.com)
- As of the above graph analysis 2023, the market value of global console statistics by types is followed by physical hardware ($19 billion), physical software ($8 billion), digital full game ($8 billion), add-on content ($15 billion), and subscription ($10 billion).
- Whereas in 2024, gaming console expected revenues by type are followed by physical hardware ($18 billion), physical software ($6 billion), digital full game ($8 billion), add-on content ($17 billion), and subscription ($11 billion).
- Lastly in 2025 and 2026 predicted revenue earned by gaming console types are physical hardware ($19 billion and ($17 billion), physical software ($6 billion and ($6 billion), digital full game ($8 billion and $7 billion), add-on content ($19 billion and $19 billion), and subscription ($11 billion and 12 billion) respectively.
You May Also Like To Read
- Gaming Earbuds Statistics
- Video Game Violence Statistics
- Baltimore Ravens Statistics
- Texas Rangers Statistics
- Houston Astros Statistics
- Pittsburgh Pirates Statistics
- Fortnite Player Count Statistics
- Buffalo Bills Statistics
Market Value by Distribution

(Reference: statista.com)
- As of the above graph analysis, in 2023 total console gaming market sales have resulted in almost $33.4 billion and $41.9 billion by PC gaming market around the world. Whereas, in 2023 packed gaming sales resulted in $7.6 billion.
- In 2024, the expected sales value of the gaming console market is $35.6 billion, and $37.8 billion by the end of 2025.
By Sales
- As of February 2023, the best-selling console game is Tetris with sales of over 520 million unit shipments around the world.
- , Minecraft is the 2nd best-selling console across the world with sales of more than 238 million copies of the game.
- As of May 2023, the best-selling console video game is PlayStation 2 with 156 million units around the world.
- As of 2023, the most-selling current-gen game console around the world is PlayStation 5 resulting in 45.4 million units.
- As of Statista reports by December 2023, Nintendo’s Switch is one of the top 5 best-selling console games with over 131 million units.
By Demographics
- According to the reports of Statista, by June 2023 around 11% of people are usually spending above 20 hours per week playing video games in the United States of America.
- Whereas, 30% of U.S. console gamers approximately spent 1 to 5 hours per week playing video games in 2023.
- As of Statista survey analysis, in September 2023 in the U.S. 28% of people aged between 20 years to 29 years played console video games regularly.
- During the same period, 58% of males and 42% of females played console games in the U.S. by September 2023.
- In 2023 based on genres, 62% of U.S. console gamers played action games and 47% of gamers played shooter games.
- According to reports, around the world average time spent on gaming consoles is almost 7.11 hours per week.
- According to data shared by ZarkCentral, in Europe, time spent on gaming consoles is approximately 7.98 hours per week.
- 35% of United States console gamers are aged between 18 years to 34 years, whereas other age groups of console gamers in countries are 34% in Japan (10 years to 19 years), and 46% in the United Kingdom (above 35 years).
- Based on income level, 54% of adults’ annual earnings is $75,000 are own a single gaming console.
By Country
- According to Statista Market Insights in the United States, revenue generated by the market is predicted to be $7.4 billion by the end of 2024.
- Revenue generated by other top countries in 2024 is followed by Japan ($2.9 billion), the United Kingdom (42. billion), France ($1.5 billion), and Germany ($973.2 million).
- Whereas, the projected market growth is expected to reach a CAGR of 1.12% (Japan), 2.93% (United Kingdom), 1.39% (France), and 1.84% (Germany) from 2024 to 2028.
By Region

(Source: technavio.com)
- According to the reports of Technovia, the gaming console industry in the Asia Pacific region, the growth rate is expected to reach 51% from 2017 to 2027.
- As of 2024, revenue earned by the APAC region over the gaming consoles market is expected to be $5.8 billion with a CAGR of 2024 to 2028.
- Furthermore, others are followed by Europe, the Middle East, and Africa (EMEA) region expected market revenue is $9.3 billion (1.92% of CAGR), in the Latin American region (4537.6 million) with a CAGR of 3.02% from 2024 to 2028.

(Source: gizmochina.com)
- As of reports in the console field, Sony is leading over Microsoft in 2023.
- In the 3rd quarter of 2023, in the market of gaming consoles market, Sony Corporation is leading with its PlayStation 5 with a market share of 54%.
- In the 2nd quarter of 2023, the sales of Play Station 5 accounted for 4.9 million units, and Spider-Man 2 with 5 million unit sales.
- Whereas in 2023, Nintendo’s shipments have dropped by 15% from last year but kept a strong share of 27% market share as of now.
- It is expected that by the end of 2024, shipment units of Nintendo Switch is going to reach 15 million units.
- Microsoft’s Xbox Series X/S shipments have also declined by 6% in 2023 resulting in 1.8 million units.
- On the other hand, the market share of Xbox Series X will account for 72% product share by 2023.

(Source: googleusercontent.com)
- According to the reports of True List in the 1st quarter of 2023, the leading gaming console sales were accounted by PlayStation 5 resulting in 1.2 million units which is followed by Nintendo Switch (1.1 million units sold), and Xbox Series (450 K units sold).
You May Also Like To Read
- Mobile Games Statistics
- Steam Statistics
- Video Gaming Statistics
- Simulation Games Statistics
- Surprising Pokémon Statistics
- PlayStation Statistics
- Minecraft Statistics
- Board Game Statistics
- esports statistics
By Operating System

(Reference: statcounter.com)
- As of the above chart representation analysis, the market share of console operating systems in the year 2023 is followed by January (PlayStation = 85.2% and Xbox = 14.76%), April (PlayStation = 84.34% and Xbox = 15.55%), August (Xbox = 96.96% and PlayStation = 3.03%), December (Xbox = 75.66%, PlayStation = 24.32%, and Nintendo = 0.02%).
Market Forecast By Market.us
- The global gaming console market is projected to grow from USD 39.3 billion in 2022 to USD 65.00 billion by 2032, with a compound annual growth rate (CAGR) of 5.30% during the 2023-2032 period.
- Gaming consoles, such as the PlayStation, Xbox, and Nintendo Switch, are designed for playing video games and are typically connected to a TV or monitor.
- Verizon reported a 115% increase in gaming usage in the U.S. compared to pre-pandemic levels, with gaming traffic during peak hours rising by 75% in March and April.
- In 2022, the Entertainment Software Association found that 66% of Americans, or over 215.5 million people, are active video game players.
- Europe leads in average weekly gaming hours, with the U.S. close behind, averaging 13 hours per week.
- 52% of U.S. gamers use dedicated gaming consoles, though smartphones remain the most popular gaming device, used by 57% of players.
- In 2021, 77% of gamers spent more than 3 hours weekly on gaming, with 51% spending over 7 hours.
- MiDIA Research reported over 180 million game subscriptions were active in 2023, projected to rise to 318.5 million by 2030.
- Microsoft’s acquisition of Activision Blizzard in January 2024 is expected to boost their game pass subscribers by adding popular franchises like Call of Duty.
- The handheld gaming market is also expected to grow, driven by key players like Nintendo, which sold approximately 15 million and 17 million units of the Nintendo Switch in 2020 and 2021, respectively.
Recent Developments
- Microsoft’s Acquisition of Activision Blizzard: In 2023, Microsoft completed its historic acquisition of Activision Blizzard for $68.7 billion. This deal significantly strengthens Microsoft’s gaming portfolio by adding popular franchises like Call of Duty to its Game Pass subscription service, potentially attracting millions of new users.
- Sony’s Market Leadership: Sony captured a record 62% share of the global gaming console market in Q1 2024. This dominance was driven by strong PlayStation 5 sales, supported by improved supply chains and the popularity of exclusive titles like “Marvel’s Spider-Man 2.” Despite a slowdown in early 2024 due to market maturity, Sony’s position remains robust.
- Apple’s Foray into Gaming: In 2024, Apple made a significant move by bringing AAA game titles such as “Assassin’s Creed Mirage” and “Resident Evil” to its iPhone Pro 15 models. This initiative aims to broaden the appeal of high-fidelity gaming beyond traditional consoles, potentially increasing Apple’s market share in the gaming sector.
- Increased M&A Activity: The gaming console market has seen a surge in mergers and acquisitions, with over 220 deals reported in 2023 alone. Companies are strategically acquiring smaller firms to expand their gaming ecosystems and stay competitive in a rapidly evolving market.
Conclusion
As of today, looking at the Gaming Consoles Statistics, there are millions of Gaming Consoles fans spread around the world. Gaming consoles started becoming popular gradually after the COVID-19 pandemic. Along with the implementation of advanced technological enhancement thus, the gaming console industry is raising billions of revenue share enormously in coming years.
The market growth of global gaming consoles is expected to grow at a CAGR of 4.11% from 2023 to 2028. This article includes several effective statistical analyses that are segmented into different sections and explained elaborately above, hope this will help in understanding the topic better.